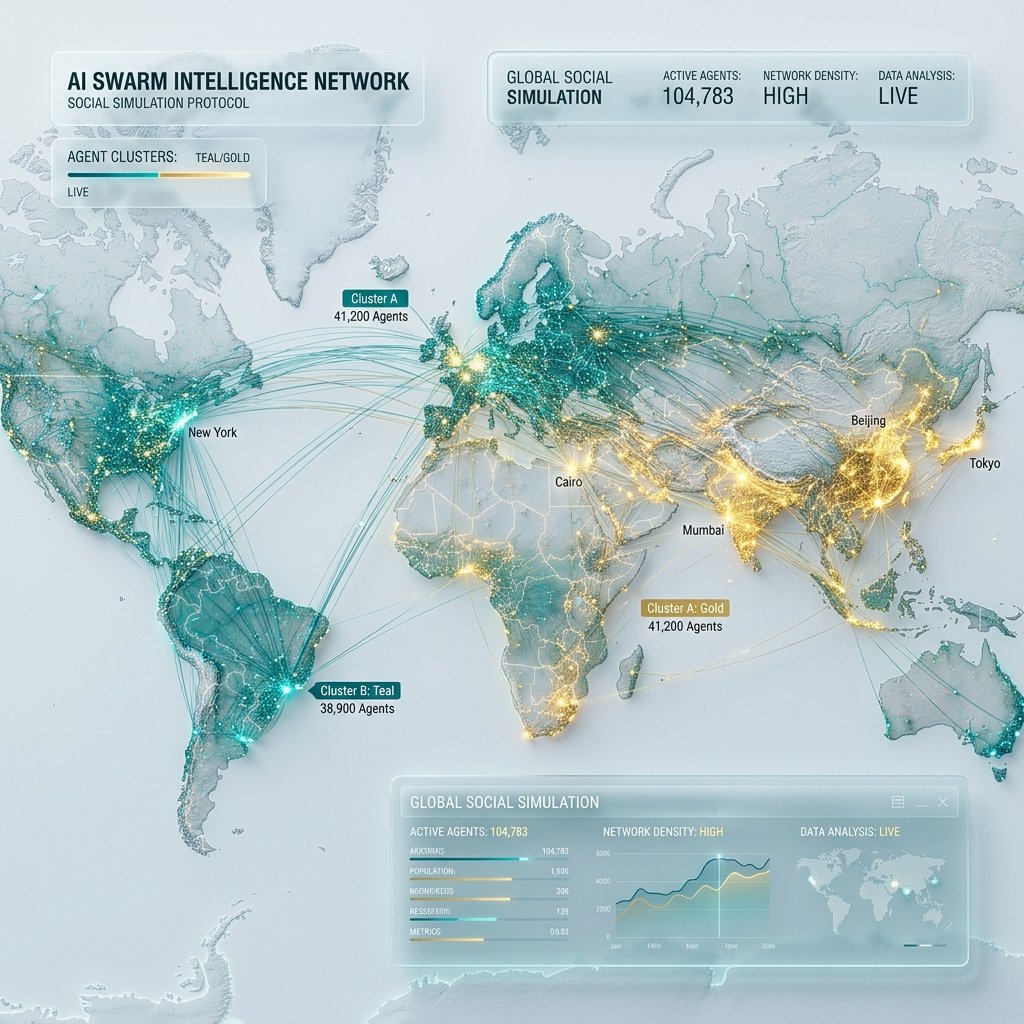
Powered by Swarm Intelligence

AI Forecasting & Social Simulation

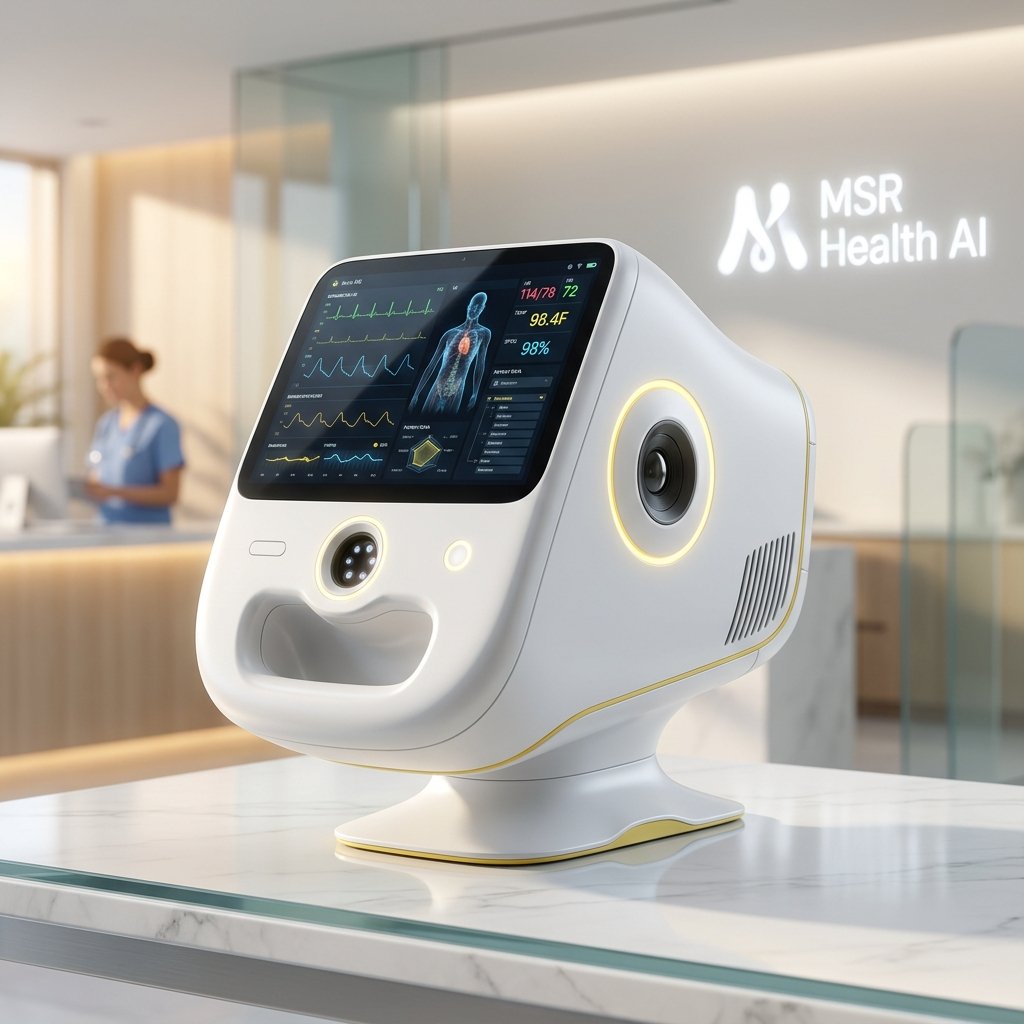
We ingest real-world inputs (news, policies, demographics) into a high-fidelity digital sandbox. Thousands of distinct AI agents interact to predict rural patient adoption, emergency surge events, and deployment ROI before a single MSR Health Kiosk is ever built.

MiroFish Concept Graph

Live Swarm Intel

Connecting to Live Simulator Backend...
Deep Case Study

A Swarm Intelligence Engine Mapping Reality

By mapping the exact demographic data, pharmacy locations, and local news of Karnataka's Raichur district onto an open-world sandbox, the AI Simulator allows us to rehearse our strategy at zero risk.

Scaling to ₹900 Crore

The generated abstract visualization highlights the steep upward growth vector from initial CapEx straight to Year 5 profitability. The simulator runs these scenarios a thousand times, refining the cost variables.

Investment Graph

📉 Financial Predictions

By simulating out-of-pocket expenditure thresholds over 12 months, the swarm logic outputs highly accurate predictions for kiosk transaction volume and the break-even ROI timeline for our investors.

👥 Social Behavior Simulation

We simulate the "Self-Medication Cycle". The agents possess dynamic memory sets representing distrust of large hospitals. We model how grassroots awareness campaigns rewrite these behavioral nodes.

♟️ Strategy Modeling

Where should the 50 Phase 1 Kiosks be placed? By releasing agents onto a parallel map containing the 42km gaps to district hospitals, the model chemically "settles" on the most critical deployment zones.

How The Simulation Loop Works

1. Real-World Inputs (Seed Extraction)

We automatically feed raw web data into the engine: WHO reports, Karnataka local healthcare policies, breaking news alerts on viral outbreaks, and the exact ratio of specialists (80% urban concentration).

2. Entity Generation

MiroFish extracts personas autonomously. It creates the "Overworked Pharmacist", the "Skeptical Farmer", the "Urban Doctor", attaching unique memory architectures to each via GraphRAG.

3. Scenario Analysis Generation

We hit "Run". Thousands of interactions trigger cascade events over hours of real-time simulation. The system compiles a post-simulation dashboard that shows: Kiosk Adoption Curve, Revenue Projections, and Avoided Stroke Incidences.

MSR Diagnostic Hardware Integration
Hardware Telemetry Layer

MSR Diagnostic Integration

The simulation engine doesn't just predict financial outcomes; it maps hardware interactions. The MSR Diagnostic Device interfaces directly with our simulated patient personas, analyzing latency, usability, and point-of-care vital tracking before field deployment.

  • Simulated hardware response times.
  • Ergonomic tracking and patient adoption curves.
  • IoT data ingestion simulations over weak 4G networks.