The Comprehensive Strategic Blueprint

An interactive deep-dive into the PRANA MSR Health operational strategy. Explore our initial investments, technology infrastructure, rigorous compliance roadmap, multi-channel marketing, and robust 5-year financial projections.

1. Capital Foundation

Initial Investment & Deployment

A structured approach to capital allocation, beginning with our immediate China R&D prototyping budget and scaling into a 5-year pan-India deployment strategy.
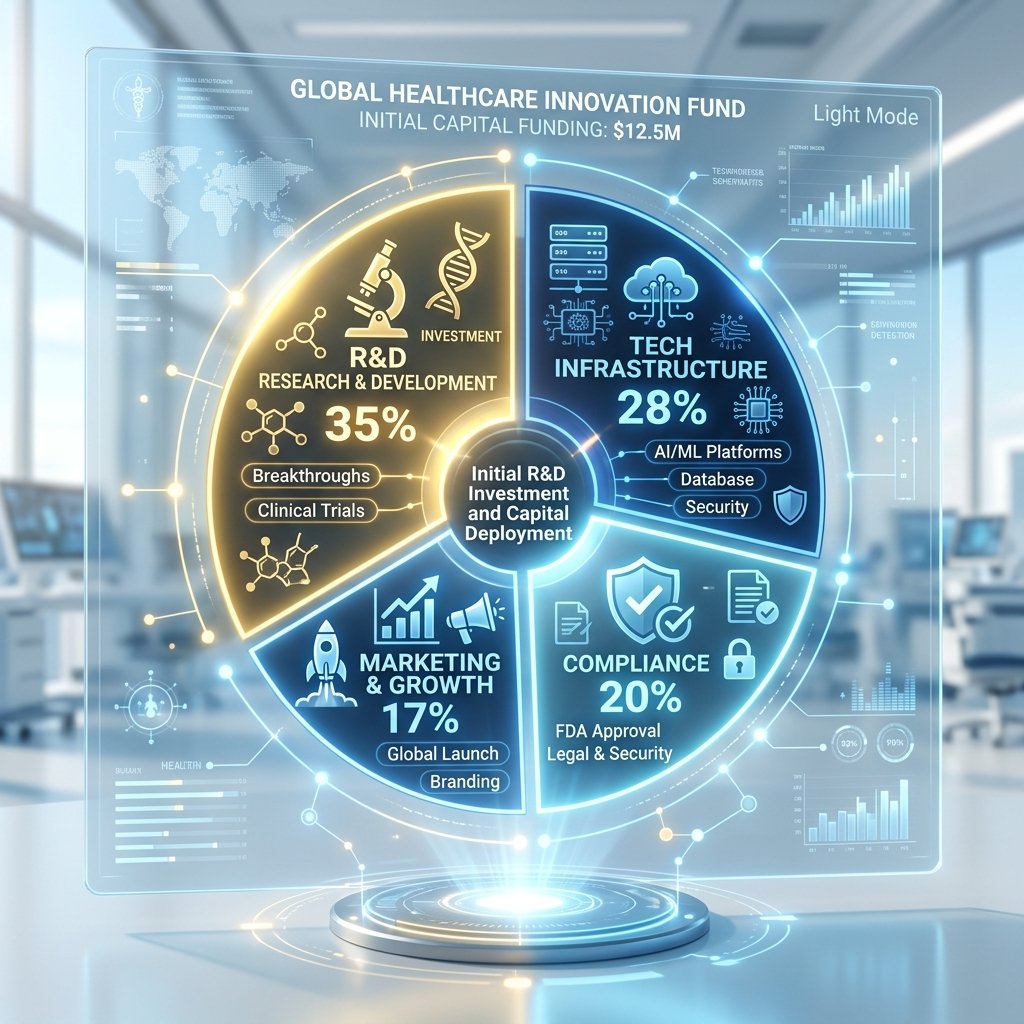
Initial R&D and Capital Deployment Breakdown

Phase 0: Immediate R&D Budget

We are executing a highly optimized immediate prototyping phase to validate hardware and local software integration during the 30–40 day Shenzhen sourcing sabbatical.

Seed Round: ₹16.00 Cr
Y1 CapEx: ₹4.30 Cr
Y1 Team: 39 FTEs

5-Year Capital & Deployment

Total equity funding of ₹111 Cr across three rounds to reach Pan-India scale — 400 kiosks, 85 pods, 22 mobile units, and 290 FTEs.

Total Funding: ₹111 Cr (Seed + A + B)
5-Yr CapEx: ₹8.00 Cr
Y5 Revenue: ₹319.04 Cr
2. Technology Stack

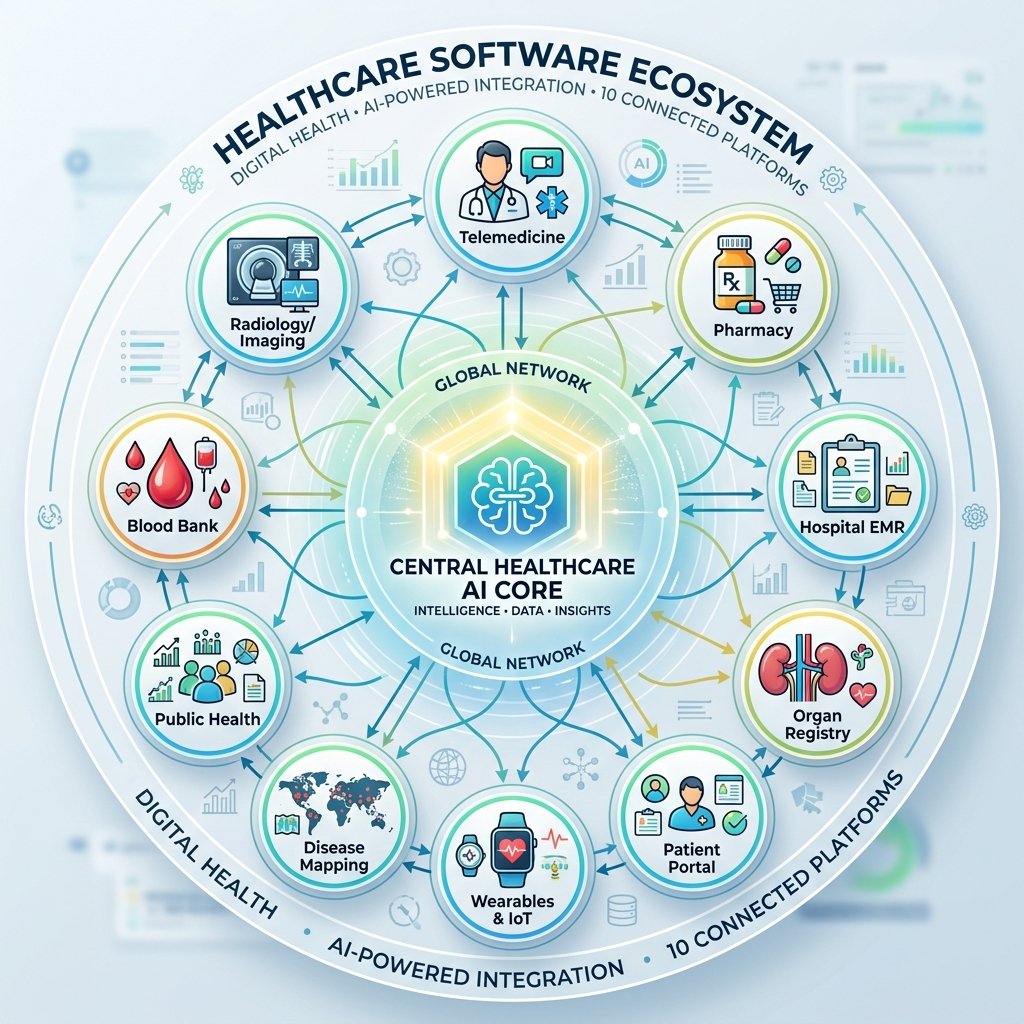
The 10-Platform Ecosystem

PRANA is not just hardware. It is a massive, interconnected digital health ecosystem orbiting a central Medical AI core, integrated with Google Cloud Platform and ABDM frameworks.

10 Platform Healthcare Ecosystem
Platform Core Functionality & Tech Revenue Model
1. MSR Connect™Telemedicine network with integrated EMR. Connects rural kiosks directly to specialist doctors via HD video.Consult fees (25–35% share), Doctor SaaS (₹3K–8K/mo)
2. GlobeBloodReal-time IoT-enabled blood bank inventory tracker.Hospital partnership fees, Govt contracts
3. GlobeOrganOrgan donation registry with AI matching engine.Institutional subscriptions
4. GeoHealth KarnatakaMacro-level disease mapping & outbreak detection using anonymized screening data.Govt health dept analytics (₹25–100L/yr)
5. PranaDrugDrug interaction checker using FDA databases.Pharmacy integration commission (3–8%)
6. PRANA Dental™AI-powered intraoral 3D scanner workflow.Device sales, facilitation fees
7. Prana Talk™Ambient medical voice AI recorder. Converts doctor-patient speech into structured SOAP notes.Hardware sales (₹28K), SaaS (₹3K/mo)
8. AI Decision SupportCore clinical workflow support (CDSS). Uses Vertex AI.Platform licensing, Screening fees
9. MSR PulsePopulation health monitoring dashboard for admins.Insurance analytics contracts
10. PRANA Mobile AppCitizen health records (ABHA linked) + AI Chatbot.Consumer engagement, cross-selling
3. Regulatory Moat

Rigorous Compliance & Clinical Validation

Operating at the intersection of AI and Healthcare requires the highest levels of global regulatory compliance, data privacy, and ethical governance.

Data Privacy & Security

  • 🛡️ DPDP Act 2023: Full compliance with India's new Digital Personal Data Protection Act. Explicit regional-language consent required.
  • 🔐 Encryption: AES-256 encryption for all data at rest and in transit on Google Cloud infrastructure.
  • 🏥 ABDM Integration: Native Ayushman Bharat Health Account (ABHA) creation and linkage.
  • ⚠️ Medico-Legal Disclaimer: The AI acts strictly as a Clinical Decision Support System (CDSS) for triage, NEVER as an autonomous diagnostician.
PhaseCertifications RoadmapTimeline
Phase 1ISO 13485 (QMS), SUGAM registration, Import License (MD-14).Months 1-6
Phase 2CDSCO Product Registration, BIS, WPC, ABDM M3 Certification.Months 6-12
Phase 3Mfg License (MD-10) for local assembly, ISO 27001, AI Sensitivity trials.Months 12-18
Phase 4Software as a Medical Device (SaMD) Validation, CE Marking.Years 2-3
4. Product Superiority

Core Advantages & Risk Mitigation

Combining 60+ diagnostic parameters with edge computing to deliver unprecedented clinical depth in a 6-minute automated workflow.

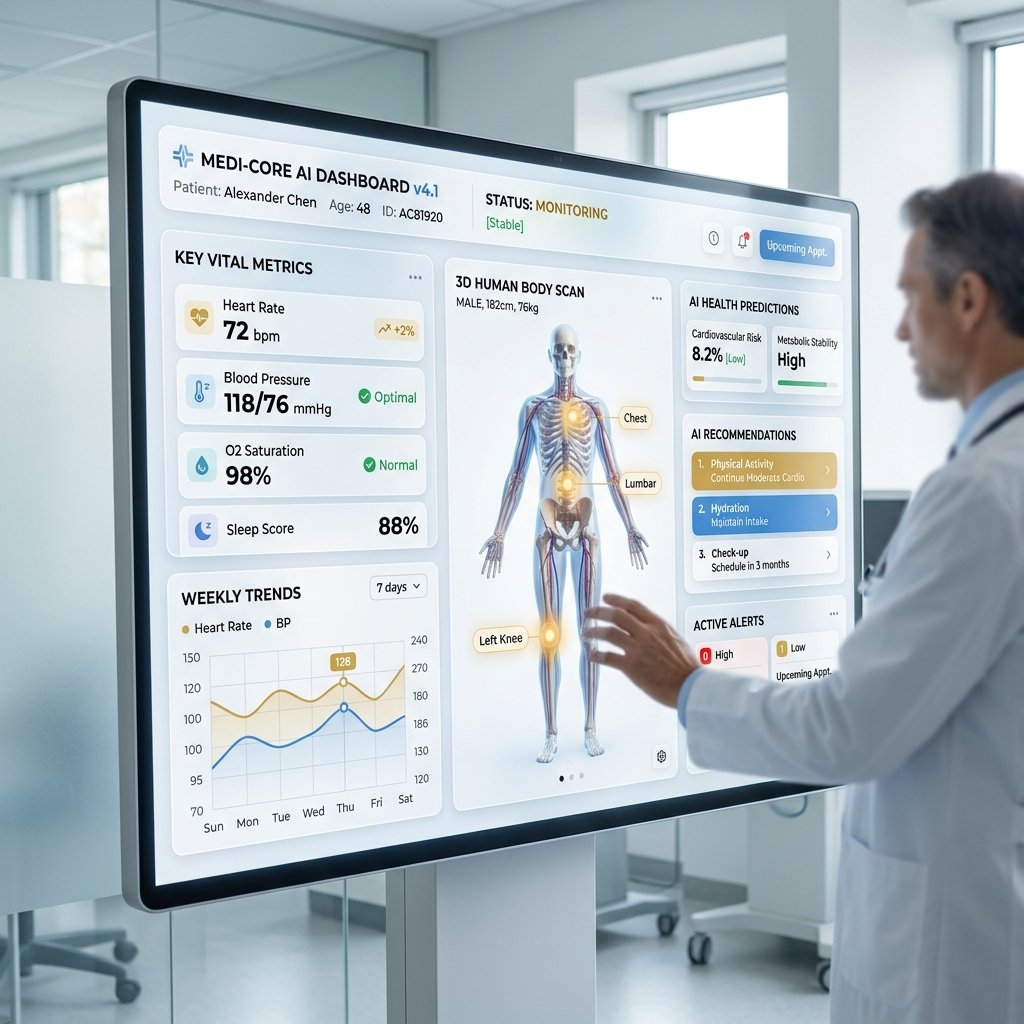
Prana AI Clinical Dashboard

Why Prana Wins

Most kiosks measure 15-20 basic vitals. PRANA MSR Health captures 60+ parameters including 12-lead ECG, comprehensive lipid profiles, HbA1c, and advanced respiratory metrics—equivalent to a Tier-1 hospital baseline diagnostic.

This density of data allows our Medical LLMs to perform high-precision predictive risk stratification that simple rule-based software cannot match.

Key Risk Mitigation Strategies
Identified RiskImpactPRANA Mitigation Strategy
Hardware Supply Chain ShockHighDual-source strategy. Structured Make-in-India roadmap to transition 60% of manufacturing to domestic EMS partners by Year 2.
AI Hallucination / LiabilityCriticalContinuous "Human-in-the-Loop" validation. AI output is explicitly watermarked as triage/decision-support only.
Govt Procurement DelaysMediumMulti-channel approach. We do not rely solely on B2G. Strong B2B and franchise pipeline mitigates cash-flow stalls.
5. Go-To-Market

Marketing Strategy & Scaling

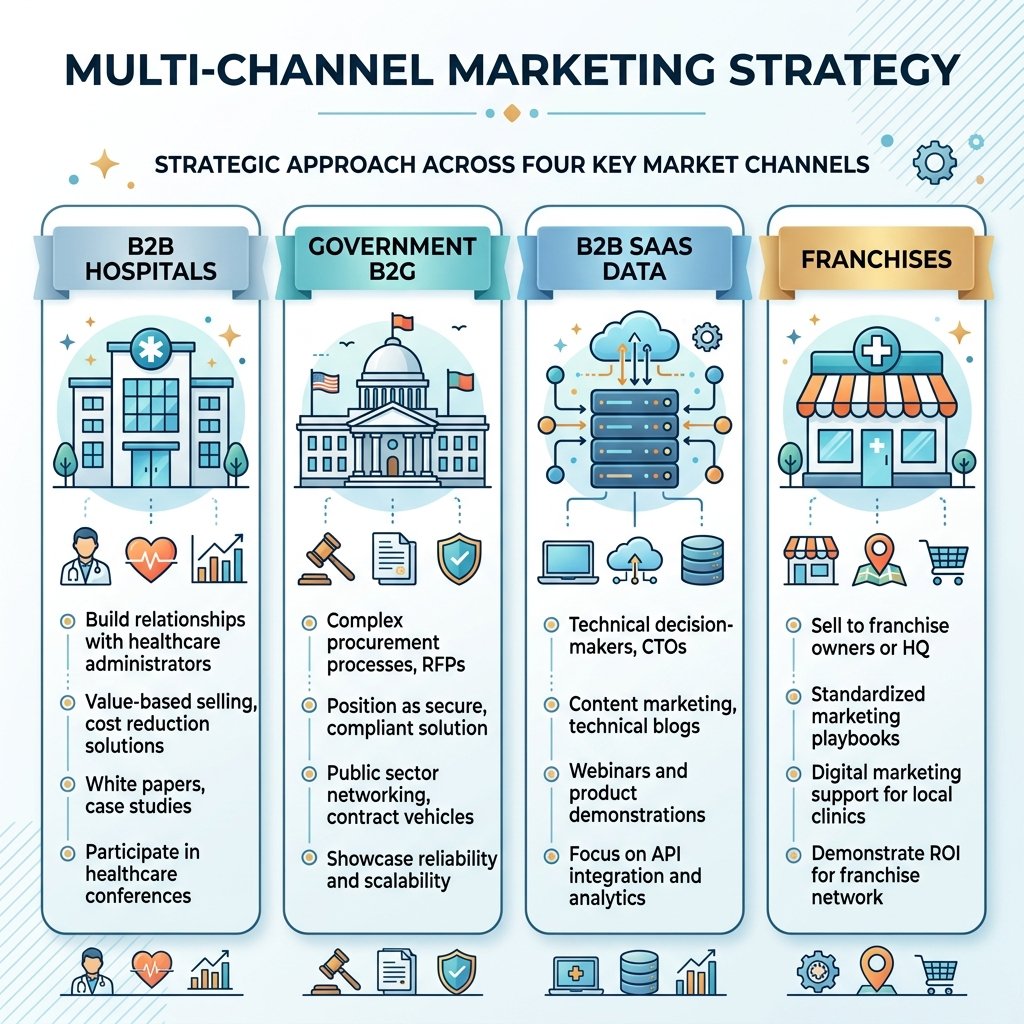
A multi-channel distribution strategy designed to capture B2B hospital networks, secure large B2G government contracts, and empower local franchises.

Multi-Channel Marketing Strategy

Phased District Scaling

We are executing a structured, geographical rollout starting from our Bengaluru headquarters.

  • 📍 Phase 1 (Year 1): 5 Districts — 25 Kiosks + 5 Pods + 2 Mobile Units. 39 FTEs.
  • 📍 Phase 2 (Year 2–3): All 31 Karnataka Districts — 150 Kiosks + 30 Pods + 10 Mobiles. 143 FTEs.
  • 📍 Phase 3 (Year 4–5): South India & National expansion — 400 Kiosks + 85 Pods + 22 Mobiles. 290 FTEs.

Hospital & Doctor Tiering

Creating an incentivized referral network ensures that kiosks drive actual admissions and teleconsultations.

  • ⚕️ Platinum Hospitals: Multi-specialty (500+ beds). High admission facilitation fee (₹1,500).
  • 👨‍⚕️ Tier 1 Doctors: Senior specialists dedicating 2+ hours daily. 75/25 revenue split.
  • 📈 Target: 2,800 active network clinicians by Year 5.
6. Revenue Architecture

Business Model & Costing Projections

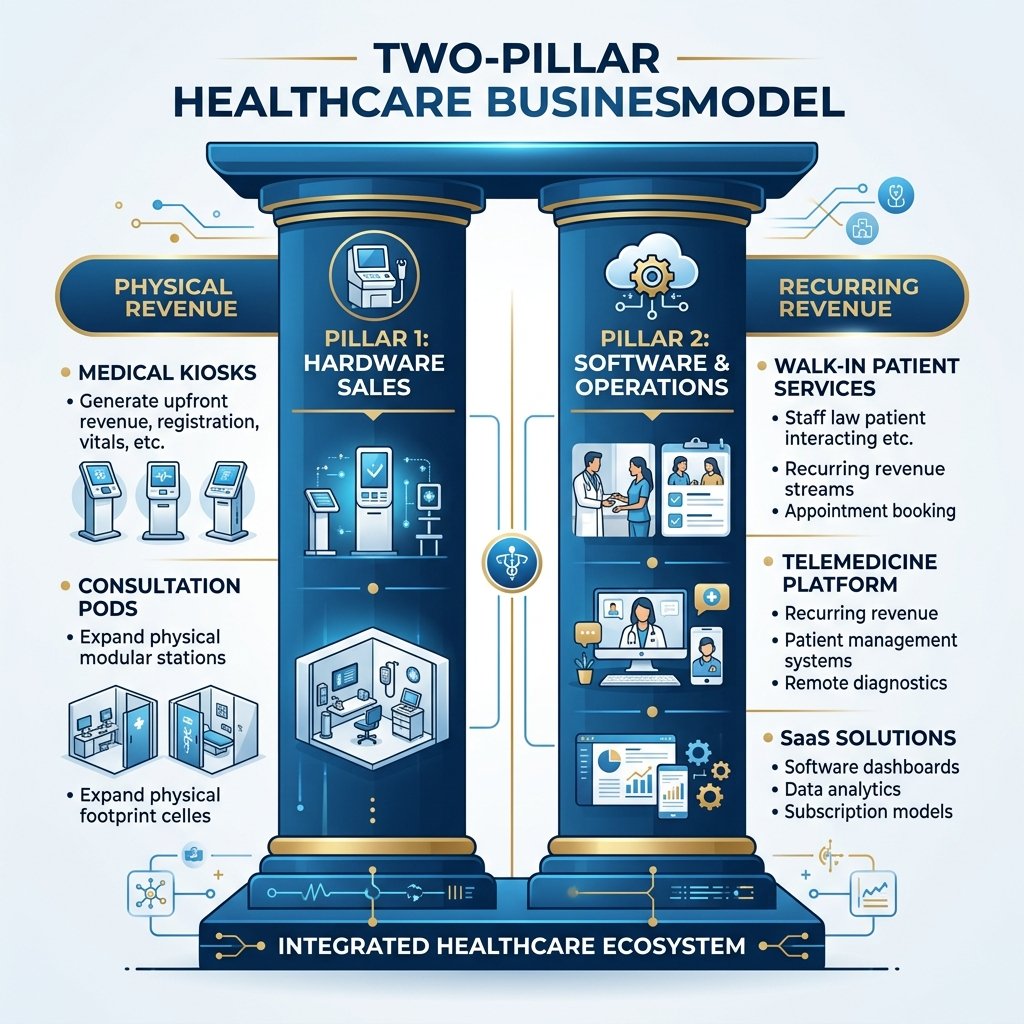
Balancing capital-intensive hardware sales with high-margin recurring software operations.

Two Pillar Business Model
Module A: Hardware Unit Costing
ProductBlended COGSSelling Price (Gross Margin)
AI Kiosk (MSR-H650)₹13.0L₹18.5L (29.7%)
Pod Clinic (500 sqft)₹13.0L₹25.0L (48.0%)
Mobile Van (Force)₹75.0L₹85.0L (41.0%)
Prana Talk Device₹12,500₹28,000 (55.0%)

Per-Kiosk Unit Economics (Module B)

The operational margins of a single own-deployed kiosk under mature (Y5) utilization:

  • 💰 Fee / Encounter: ₹250 (Y5) — scales from ₹150 in Y1
  • 📈 Encounters / Unit / Month: 700 (Y5 mature)
  • 👥 Y5 Total Encounters: 27.72 Lakh (across 330 avg active)
  • 💵 Kiosk Revenue (Y5): ₹69.30 Cr
  • ⏱️ CAC Payback: ~1.7 Months (Y5 logo-level)

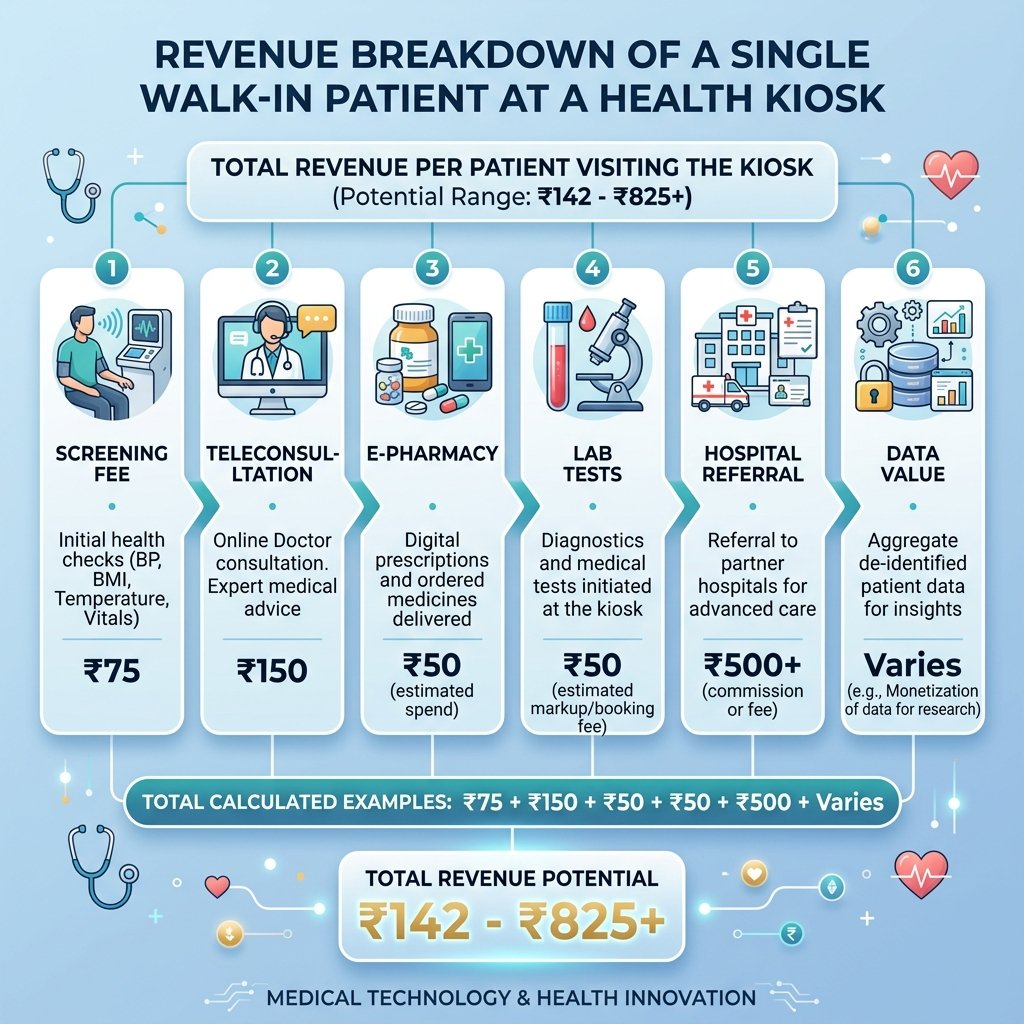
Module B: Revenue Per Walk-In Patient

Revenue per Walk-in Patient
7. Capitalization Strategy

Funding Structure & Use of Funds

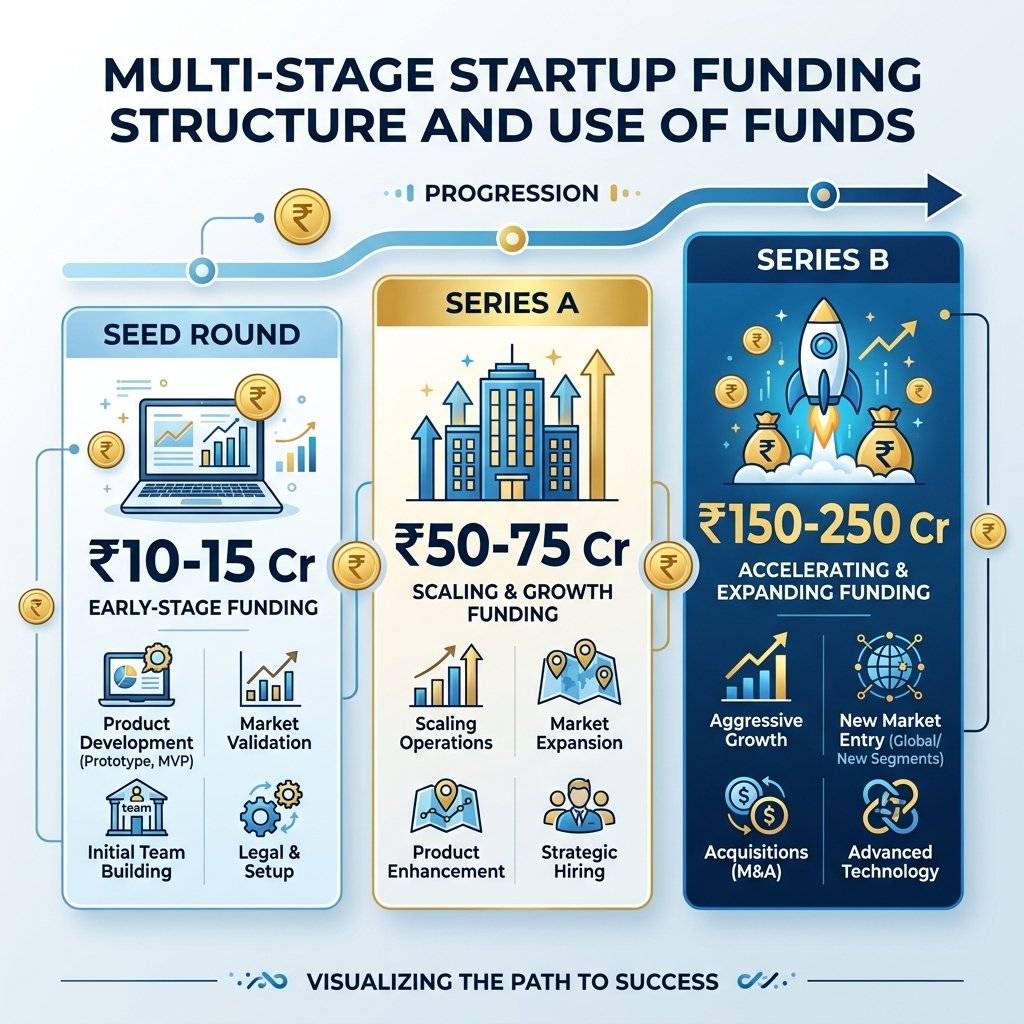
A phased equity financing structure of ₹111 Cr across Seed, Series A, and Series B — designed to fund deployment ramp, working capital, and software ecosystem scaling while maintaining a strong balance sheet.

Startup Funding Structure
Funding Stages & Deployment
RoundTarget AmountPrimary Use of Funds
Seed₹16 CrPrototyping, CDSCO/ISO compliance, initial 25 kiosks + 5 pods + 2 mobile units pilot in Karnataka. Pre-money ₹48 Cr / Post-money ₹64 Cr.
Series A₹55 CrFull Karnataka rollout (150 kiosks), working capital expansion, software ecosystem scaling. Pre-money ₹165 Cr / Post-money ₹220 Cr.
Series B₹40 CrSouth India & national scaling (260→400 kiosks), assembly facility. Pre-money ₹360 Cr / Post-money ₹400 Cr.
Post-Series BStrategic PPPPan-India public sector fleet expansion and Arogya Karnataka integration. Y5 exit valuation: ₹2,074 Cr (6.5x base).
Projected Shareholding & Dilution Model (Post All Rounds)
Stakeholder CategoryPost-SeedPost-Series APost-Series B (Y5)
Founders & MSR Group75.0%56.25%50.625%
Seed Investors25.0%18.75%16.875%
Series A Investor25.0%22.5%
Series B / Institutional PE10.0%
CHECK: Total100%100%100%
8. Competitive Landscape

Market Comparison

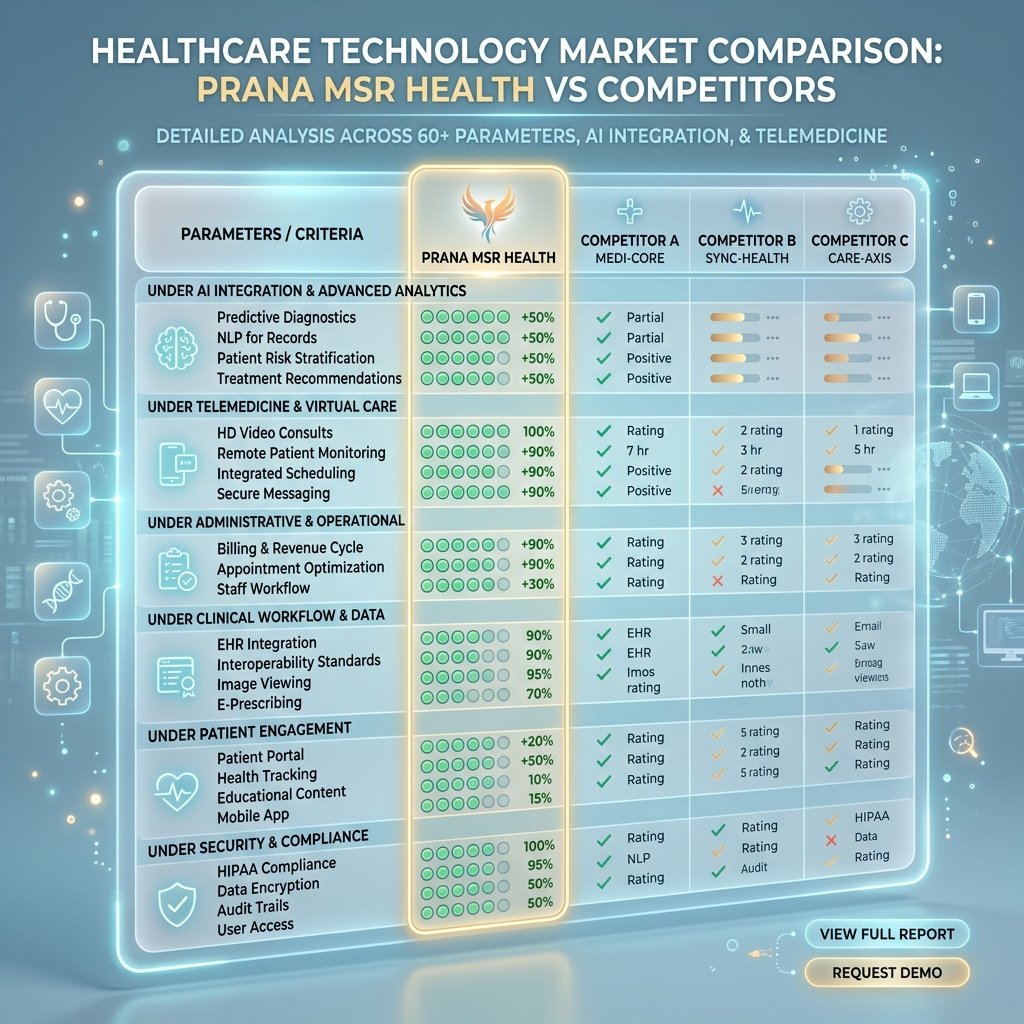
How PRANA MSR Health differentiates itself from pure-play software aggregators and basic hardware vendors.

Market Comparison Table
Competitor Profile Ecosystem Strength Telemedicine ABDM Ready The PRANA Difference
PRANA MSR HealthHardware + AI + Ramaiah Hospital NetworkNative WorkflowNative60+ Parameters + Deep AI Clinical Support
Basic Health ATMs (e.g. YoloHealth)Kiosk Hardware onlyBasicPlannedLacks deep clinical workflow and brand trust.
Remote Monitoring (e.g. Dozee)Strong Continuous VitalsNoYesFocused on ICU beds, not walk-in preventive screening.
Aggregators (e.g. Tata 1mg, Apollo 24/7)Strong Consumer Analytics & App baseApp-basedPartial/YesLacks physical hardware diagnostic infrastructure in rural areas.
9. Proforma P&L

5-Year Profit & Loss Statement (₹ Lakhs)

Formula-driven from Investor Model v5. Revenue recognition per Ind AS 115. All cells reference the Assumptions sheet — zero manual override.

Line ItemFY26-27FY27-28FY28-29FY29-30FY30-31
Revenue2601,9116,54615,95431,904
Total COGS2471,2513,1476,44412,546
Gross Profit146613,3999,51019,358
Gross Margin %5.3%34.6%51.9%59.6%60.7%
  S&M (comp + programs)1307652,4875,58410,209
  R&D (comp + cloud)4701,0109281,0661,285
  G&A (comp + rent + other)1314211,1782,3934,148
Total OpEx7312,1954,5939,04315,642
EBITDA(717)(1,534)(1,194)4673,716
EBITDA Margin %-275.5%-80.3%-18.2%2.9%11.6%
Depreciation86110120136160
Interest Income022207130309
Tax (25.17%)000116973
Net Income(803)(1,622)(1,107)3462,893

The MedTech J-Curve: Deconstructing PRANA Health's 5-Year Proforma

A detailed walkthrough of our financial model, capital deployment strategy, and the trajectory from R&D investment to exponential SaaS revenue.

10. Revenue Architecture

Bottom-Up Revenue Model by Product Line

Six distinct revenue streams driving ₹319 Cr Y5 topline. Platform SaaS overtakes hardware by Year 3 — reaching 60% of revenue mix by Year 5.

Revenue StreamFY26-27FY27-28FY28-29FY29-30FY30-31
Kiosk Encounters₹56L₹312L₹1,260L₹3,321L₹6,930L
Pod Subscriptions₹36L₹180L₹486L₹1,020L₹1,848L
Mobile Unit Contracts₹120L₹473L₹1,125L₹2,080L₹3,230L
MSR Services (Assembly+AMC)₹48L₹98L₹245L₹435L₹696L
Platform SaaS (Clinicians)₹0₹825L₹3,250L₹8,450L₹18,000L
PranaDrug (Rx)₹0₹24L₹180L₹648L₹1,200L
TOTAL REVENUE₹2.60 Cr₹19.11 Cr₹65.46 Cr₹159.54 Cr₹319.04 Cr
Hardware/Services Mix100%55.6%47.6%43.0%39.8%
Platform/SaaS Mix0%44.4%52.4%57.0%60.2%

Deployment Fleet (EOP)

  • 🏥 AI Kiosks: 25 → 60 → 150 → 260 → 400
  • 🏢 Pod Clinics: 5 → 15 → 30 → 55 → 85
  • 🚐 Mobile Units: 2 → 5 → 10 → 16 → 22
  • 👨‍⚕️ Clinicians: 150 → 400 → 900 → 1,700 → 2,800
  • 👥 FTEs: 39 → 86 → 143 → 209 → 290

Valuation Bridge (Y5 Exit)

  • 📊 Y5 Revenue: ₹319 Cr
  • 🐻 Bear (5.0x): ₹1,595 Cr EV
  • 📈 Base (6.5x): ₹2,074 Cr EV
  • 🐂 Bull (8.0x): ₹2,552 Cr EV
  • 💎 Seed MOIC: 21.9x | Series A: 8.5x | Series B: 5.2x
  • 🏆 Founder Equity Value: ₹1,050 Cr (at 6.5x base)
11. Growth Trajectory

Comprehensive Financial Projections

Interactive data visualizations from the formula-driven 5-Year Investor Model v5. All figures in ₹ Crores sourced directly from the P&L, Revenue Model, Balance Sheet, and Scenarios sheets.

5-Year Revenue & Net Income (₹ Cr)

Revenue Mix: Hardware vs Software

Closing Cash & Cumulative CapEx (₹ Cr)

Gross Margin & EBITDA Margin Trajectory (%)